
1. Chapter at a Glance
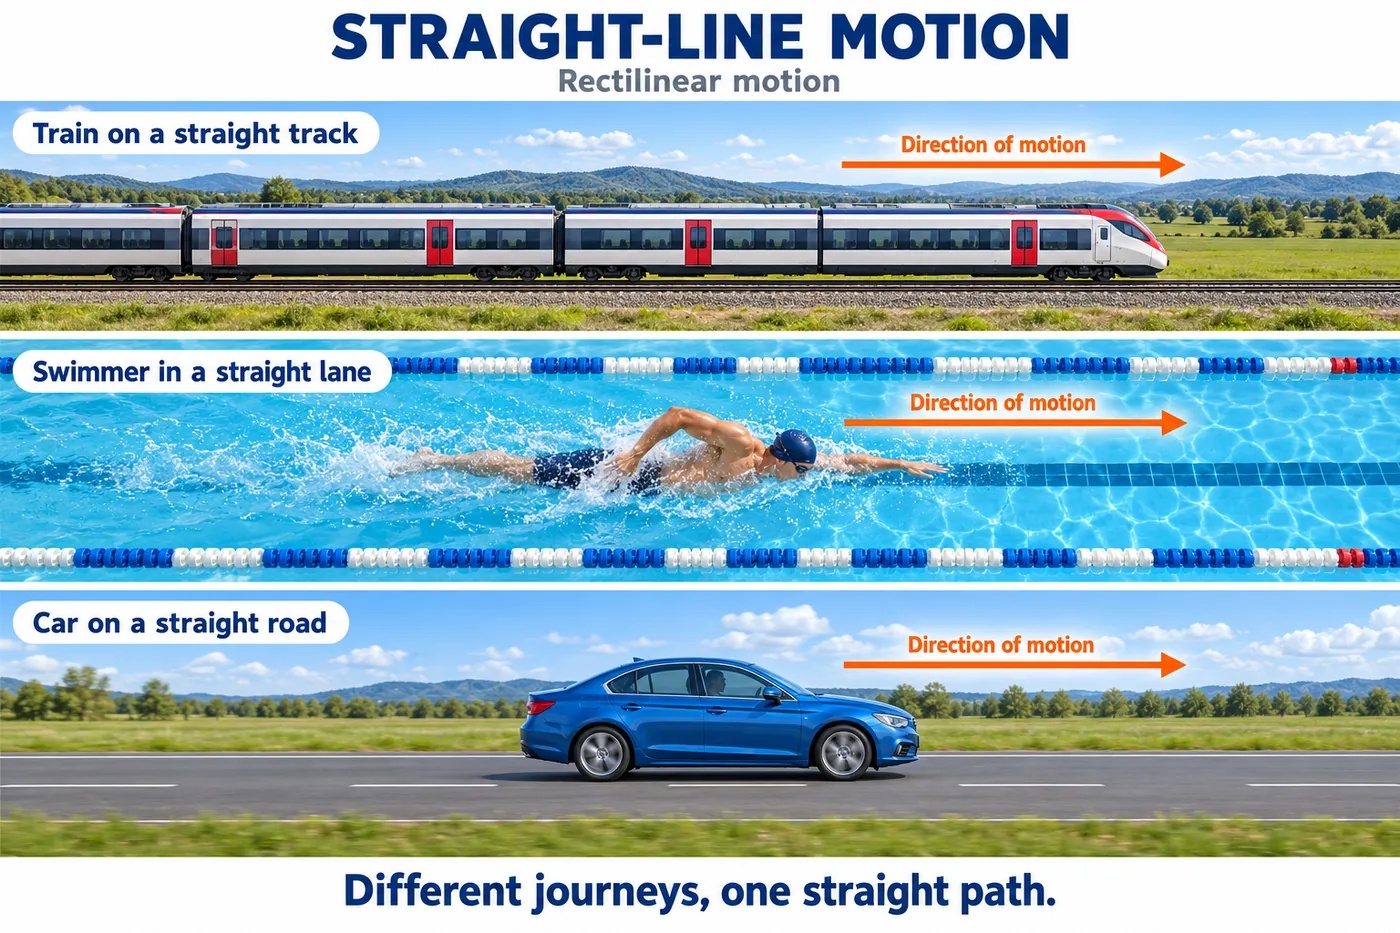
A train speeding along a straight track, a swimmer in a lane, a satellite circling the Earth and a football curving through the air — all are in motion. To describe motion precisely we need a reference point, and quantities such as distance, displacement, speed, velocity and acceleration. This chapter builds these ideas, shows how graphs tell the story of motion, derives the equations of motion for constant acceleration, and introduces motion in a plane.
- Position, reference point and straight-line motion.
- Distance (scalar) vs displacement (vector).
- Average speed, average velocity and acceleration.
- Position–time and velocity–time graphs; slope and area.
- Kinematic equations for constant acceleration; motion in a plane and circular motion.
2. Motion in a Straight Line and Describing Position
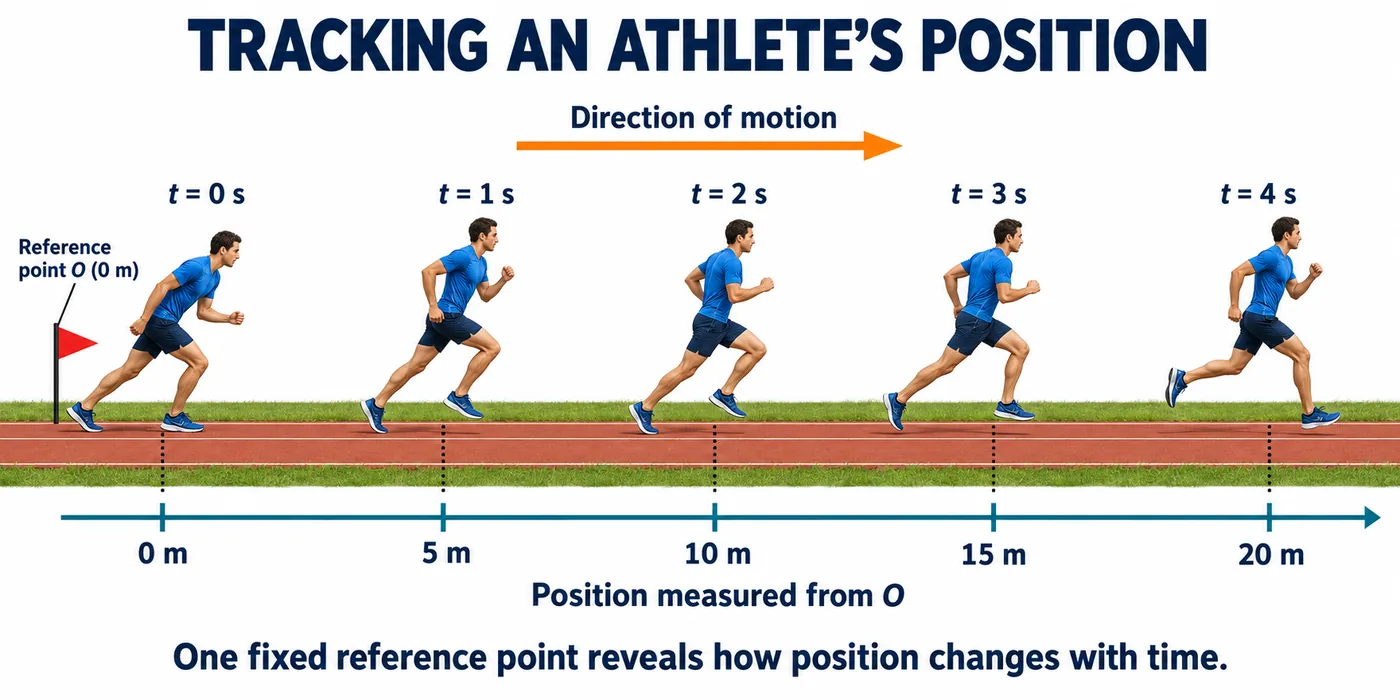
An object is in motion if its position changes with time with respect to a reference point (origin). Motion along a straight line is rectilinear (one-dimensional) motion. On a straight line we describe position by a number with a sign: +20 m means 20 m on the positive side of the origin, −5 m means 5 m on the other side.
3. Distance and Displacement
- Distance — total length of the path travelled. It is a scalar (has only magnitude) and is always positive.
- Displacement — the shortest straight-line change in position from the initial to the final point, with direction. It is a vector and can be positive, negative or zero.
SI unit of both: metre (m). Magnitude of displacement ≤ distance.
A student walks 40 m east and then 30 m west. Distance = 40 + 30 = 70 m. Displacement = 40 − 30 = 10 m east. If she returns to the start, displacement = 0 although distance is 80 m.
An athlete runs one full round of a circular track of radius 7 m. Distance = 2πr = 2 × 22/7 × 7 = 44 m; displacement = 0. After half a round, distance = 22 m, displacement = diameter = 14 m.
4. Average Speed and Average Velocity
Average speed = Total distance ÷ Total time
Average velocity = Displacement ÷ Total time
SI unit: m/s (also km/h; 1 km/h = 5/18 m/s). Speed is a scalar; velocity is a vector. Uniform motion: equal displacements in equal intervals (constant velocity). Non-uniform motion: velocity changes.
A cyclist goes 6 km north in 20 min and returns 6 km south in 30 min. Average speed = 12 km ÷ (50/60) h = 14.4 km/h. Average velocity = 0 ÷ time = 0.
5. Average Acceleration
Acceleration is the rate of change of velocity.
a = (v − u) ÷ t
where u = initial velocity, v = final velocity, t = time. SI unit: m/s². Acceleration is positive when velocity increases in the positive direction; when velocity decreases it is called retardation/deceleration (negative acceleration). Motion with constant acceleration is uniformly accelerated motion — e.g. a freely falling body (g ≈ 9.8 m/s²).
A car’s speed increases from 18 km/h to 54 km/h in 5 s. u = 5 m/s, v = 15 m/s. a = (15 − 5) ÷ 5 = 2 m/s². Brakes then stop it in 3 s from 15 m/s: a = (0 − 15) ÷ 3 = −5 m/s².
6. Graphical Representation of Motion
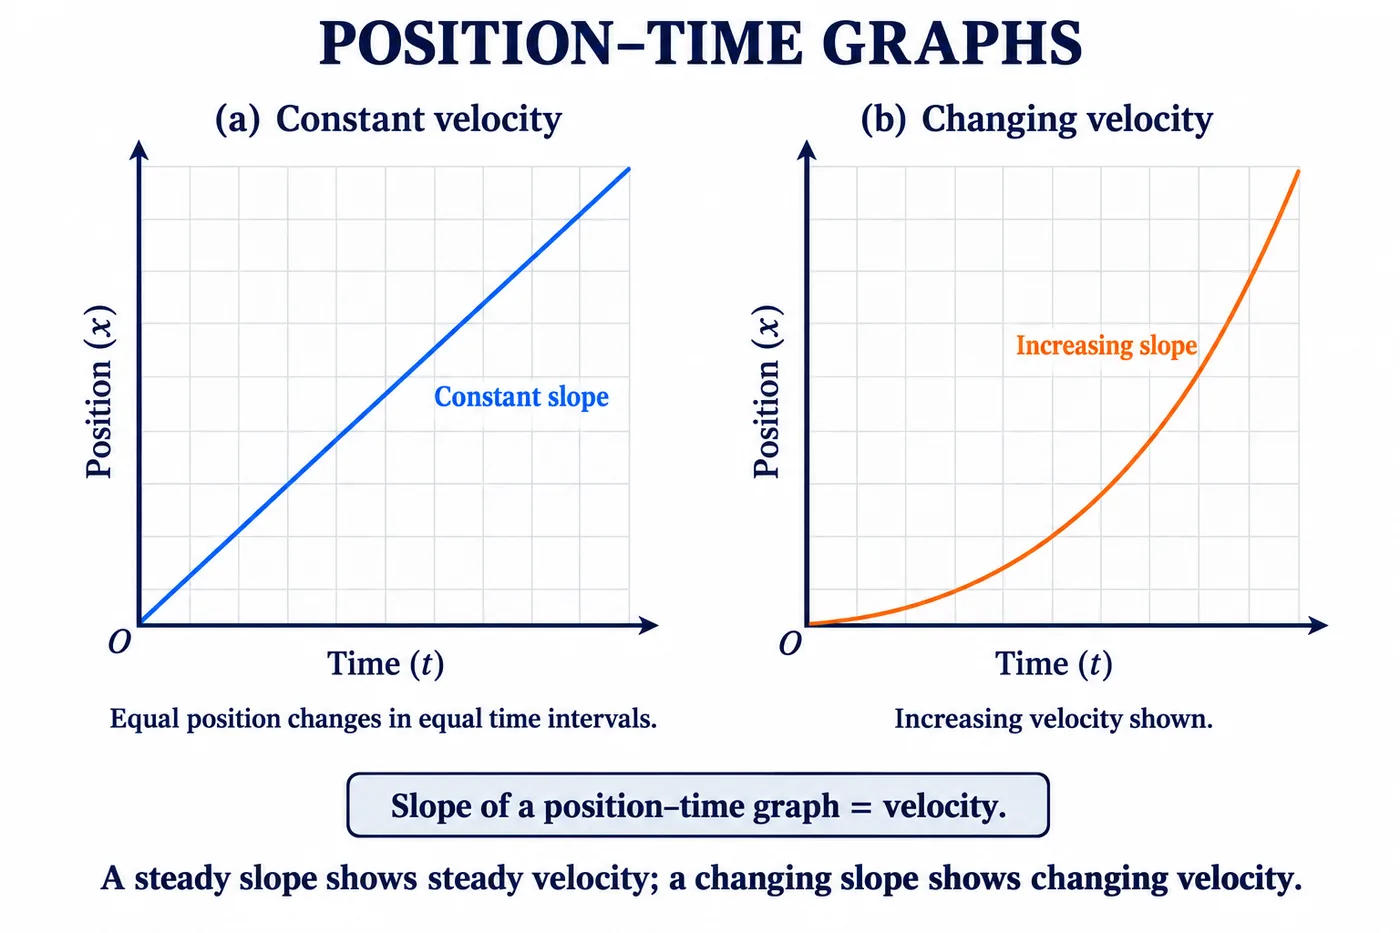
Position–time (x–t) graph
- Horizontal line → object at rest.
- Straight sloping line → uniform velocity; slope = velocity.
- Curve with increasing slope → velocity increasing (accelerated motion).
Velocity–time (v–t) graph
- Horizontal line → constant velocity.
- Straight sloping line → uniform acceleration; slope = acceleration.
- Area under the v–t graph = displacement.
7. Kinematic Equations for Constant Acceleration
From the v–t graph above (initial velocity u, final velocity v, constant acceleration a, time t, displacement s):
- v = u + at — from slope: a = (v − u)/t.
- s = ut + ½at² — area = rectangle (ut) + triangle (½ × t × at).
- v² = u² + 2as — eliminating t from the first two.
A train starting from rest accelerates at 0.5 m/s² for 1 minute. u = 0, a = 0.5 m/s², t = 60 s. v = 0 + 0.5 × 60 = 30 m/s. s = 0 + ½ × 0.5 × 60² = 900 m.
A car moving at 20 m/s brakes with −4 m/s². Stopping distance: 0 = 20² + 2(−4)s → s = 400 ÷ 8 = 50 m. Time = (0 − 20)/(−4) = 5 s.
8. Motion in a Plane
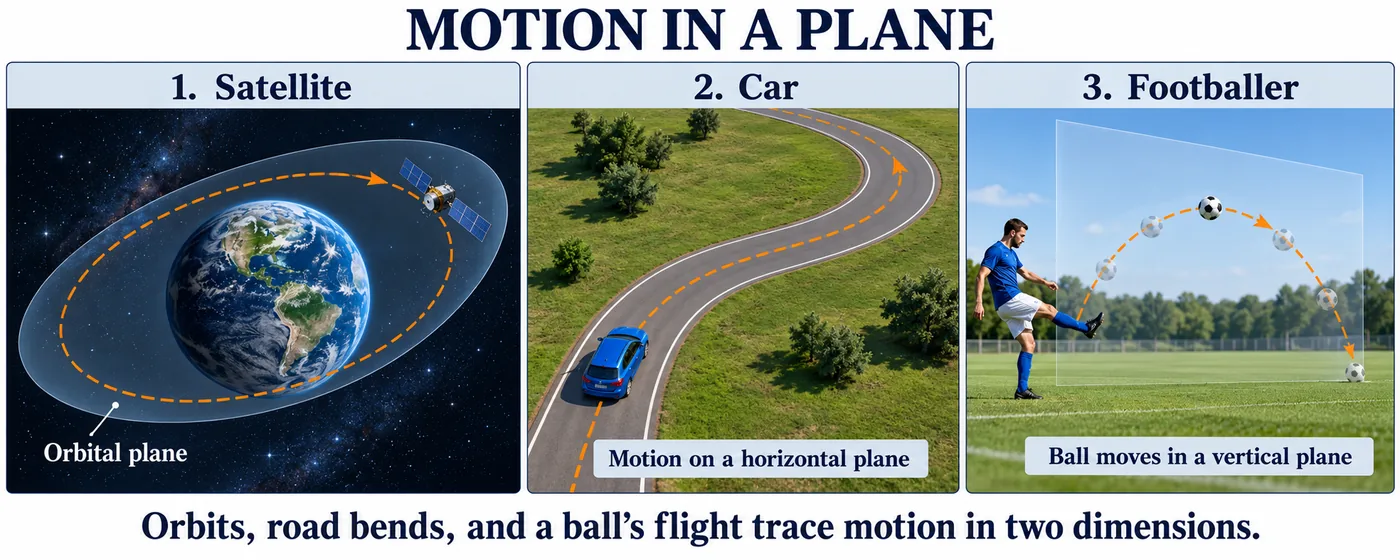
Many motions are not along a straight line. A car on a winding road moves in a horizontal plane; a kicked football follows a curved path in a vertical plane; a satellite moves in an orbit. Such motions need two coordinates (two-dimensional motion).
Uniform circular motion: an object moving in a circle at constant speed. Its direction changes every moment, so its velocity changes — it is accelerated even though speed is constant. Speed = 2πr ÷ T (T = time for one round). Examples: tip of a clock’s hand, an athlete on a circular track, the Moon around the Earth (approximately).
An artificial satellite moves in a circular orbit of radius 42 250 km and completes one round in 24 h. Speed = 2 × 3.14 × 42 250 ÷ 24 ≈ 11 054 km/h ≈ 3.07 km/s.
9. Master Table: Formulas
| Quantity | Formula | SI unit |
|---|---|---|
| Average speed | Total distance / total time | m/s |
| Average velocity | Displacement / time; for uniform acceleration (u + v)/2 | m/s |
| Acceleration | a = (v − u)/t | m/s² |
| 1st equation | v = u + at | — |
| 2nd equation | s = ut + ½at² | — |
| 3rd equation | v² = u² + 2as | — |
| Circular motion speed | v = 2πr/T | m/s |
| km/h → m/s | × 5/18 | — |
10. Master Summary Table
| Graph shape | x–t graph means | v–t graph means |
|---|---|---|
| Horizontal line | At rest | Constant velocity |
| Straight sloping line | Uniform velocity | Uniform acceleration |
| Curve | Non-uniform velocity | Non-uniform acceleration |
| Slope | Velocity | Acceleration |
| Area under graph | — | Displacement |
Chart — positions of the athlete in the image (5 m/s, uniform):
11. Mind Map
- Reference point
- Distance vs displacement
- Speed, velocity
- Acceleration
- x–t slope = v
- v–t slope = a, area = s
- v = u + at, s = ut + ½at²
- v² = u² + 2as; circular motion
12. Tips and Tricks
- List u, v, a, t, s first; pick the equation that has the four you need.
- “Starts from rest” → u = 0; “comes to rest” → v = 0; “dropped” → u = 0, a = g.
- Convert km/h to m/s before using equations.
- Using distance in the velocity formula instead of displacement.
- Forgetting the negative sign for retardation.
- Saying an object in uniform circular motion is not accelerating.
13. Important One-liners
- Motion is change in position with time relative to a reference point.
- Distance is a scalar; displacement is a vector.
- Displacement can be zero even if distance is not.
- Velocity is speed in a given direction.
- Acceleration = change in velocity ÷ time; SI unit m/s².
- Slope of x–t graph = velocity.
- Slope of v–t graph = acceleration; area = displacement.
- v = u + at; s = ut + ½at²; v² = u² + 2as.
- Uniform circular motion is accelerated motion.
14. Exam-pattern Questions with Detailed Answers
The slope of a velocity–time graph gives:
- Distance
- Displacement
- Acceleration
- Speed
Show answer
Slope = change in velocity ÷ time = acceleration. The area under it gives displacement.
Answer: (C) Acceleration
Convert 72 km/h into m/s.
Show answer
72 × 5/18 = 20 m/s.
Answer: 20 m/s
Can displacement be zero when distance is not zero? Give an example.
Show answer
Yes. Running one full round of a track returns you to the start: displacement 0, distance = perimeter.
Answer: Yes — a complete round trip
A bus decreases its speed from 80 km/h to 60 km/h in 5 s. Find its acceleration.
Show answer
u = 80 × 5/18 = 22.2 m/s; v = 60 × 5/18 = 16.7 m/s. a = (16.7 − 22.2)/5 ≈ −1.1 m/s² (retardation).
Answer: ≈ −1.1 m/s²
Assertion (A): An athlete moving on a circular track at constant speed has acceleration. Reason (R): Direction of velocity changes continuously in circular motion.
- Both true; R explains A
- Both true; R does not explain A
- A true, R false
- A false, R true
Show answer
Velocity is a vector; changing direction means changing velocity, i.e. acceleration.
Answer: (A)
A ball is dropped from a building and hits the ground in 3 s. Find its speed on hitting the ground and the height (g = 9.8 m/s²).
Show answer
u = 0. v = 0 + 9.8 × 3 = 29.4 m/s. s = ½ × 9.8 × 3² = 44.1 m.
Answer: 29.4 m/s; 44.1 m
What does a straight line parallel to the time axis on (a) an x–t graph and (b) a v–t graph indicate?
Show answer
(a) Position does not change — the object is at rest. (b) Velocity does not change — uniform motion (zero acceleration).
Answer: (a) Rest; (b) constant velocity
A car moving at 15 m/s accelerates uniformly at 2 m/s² for 10 s. Find final velocity and distance covered.
Show answer
v = 15 + 2 × 10 = 35 m/s. s = 15 × 10 + ½ × 2 × 100 = 150 + 100 = 250 m.
Answer: 35 m/s; 250 m
Derive v² = u² + 2as using the velocity–time graph.
Show answer
Area under v–t graph (trapezium) = s = ½(u + v)t. From v = u + at, t = (v − u)/a. Substituting: s = ½(u + v)(v − u)/a = (v² − u²)/(2a). Hence v² − u² = 2as, or v² = u² + 2as.
Answer: s = ½(u+v)t with t = (v−u)/a gives v² = u² + 2as
Case-based: Two cars A and B start together. A moves at a constant 20 m/s. B starts from rest with 2 m/s². (a) When will B have the same speed as A? (b) Where will B overtake A? (c) Which graph shape represents each car on an x–t graph?
Show answer
(a) 20 = 0 + 2t → t = 10 s. (b) Equal positions: 20t = ½ × 2 × t² → t = 20 s; position = 400 m. (c) A: straight line (uniform velocity); B: upward curve (parabola, accelerating).
Answer: 10 s; at 400 m after 20 s; line vs curve
A train travels 90 km at 45 km/h and then another 90 km at 90 km/h. Find its average speed. Why is it not 67.5 km/h?
Show answer
Time 1 = 90/45 = 2 h; time 2 = 90/90 = 1 h. Average speed = 180/3 = 60 km/h. It is not the simple average because the train spends more time at the lower speed.
Answer: 60 km/h
A stone is thrown vertically upward with 19.6 m/s. Find the maximum height and time to reach it (g = 9.8 m/s²).
Show answer
At the top v = 0; a = −9.8 m/s². 0 = 19.6² − 2 × 9.8 × h → h = 384.16/19.6 = 19.6 m. Time: 0 = 19.6 − 9.8t → t = 2 s.
Answer: 19.6 m; 2 s
15. Quick Revision Summary
- Motion is relative to a reference point; straight-line motion uses signed positions.
- Distance (scalar, path length) vs displacement (vector, shortest change).
- Average speed = distance/time; average velocity = displacement/time; a = (v − u)/t.
- x–t slope = velocity; v–t slope = acceleration; v–t area = displacement.
- v = u + at; s = ut + ½at²; v² = u² + 2as; circular motion: v = 2πr/T, always accelerated.